The Basics
What is this?
A feed for the weather information displayed on our company's printer. It was inspired by Kovaya's printer weather info project.
Kovaya displays the local weather on his printer. I didn't think that that was very useful here, because I could just look outside the window to find that out. Besides, I don't care about numbers like what the barometric pressure is so much as I want to know how nice of a day it is.
I also thought it'd be more useful to display the weather at the other sites our company owns.
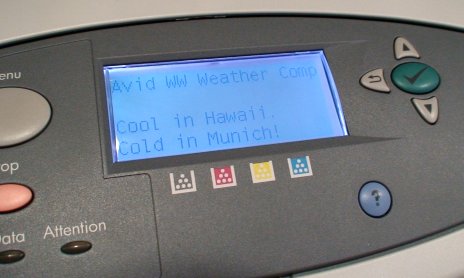
But since the printer is limited to a display of only 4x20, I had to create a very small report. So the printer only displays the location with the very best weather, and then the location with the very worst weather.
Is this for real?
Yes.
Our printer really does display a weather analysis that gets updated every hour.
It was really fun at first. I could go to the printer, and instantly find out where I'd rather be. But after a while, it turned out that it's too much trouble to have to visit the printer. So I made this feed for the weather competition.
This website is essentially a mirror of the printer's display.
Sounds dumb. Why bother?
If you can consider haiku or executive summaries art, then this can be a form of art too. All three forms of communication are attempts to distill enormous amounts of content into very small spaces.
Given a canvas of four lines of 20 characters each, how can you aesthetically summarize the world's weather? The aesthetics alone takes two lines of the four: One line for the title, and one line of blank space. That leaves two lines for the world's weather.
I didn't want to provide any numbers to be mentally processed. The message had to be as simple as possible. I chose to distill the weather into one adjective phrase and the location. Since there are only two lines, I include only the sites that evaluate to the best and worst weather. All the other sites are understood to be "somewhere inbetween."
The Nitty Gritty
How does it work?
The back-end is a Python script that uses the metar module. It looks up a few weather reports for some designated ICAO airport codes. Then it processes them according to a sophisticated algorithm.
It sorts the weather according to a score based on the temperature, wind, dew point, and other specified conditions. Then, for the printer, it prints out only the city with the very best weather, and the city with the worst weather. (So I know where I especially don't want to be.)
There are hints about the algorithm that pop up as tooltips if you mouse-over the cities' links on the details page.
The Disclaimer
This service is endorsed by neither any meteorological society nor by Avid Technology. The weather is subject to change without notice. Avid® is a trademark of Avid Technology.